

NetCrafter is an intuitive platform for constructing functional gene networks using biological ontologies and curated knowledgebases. It enables users to build biologically meaningful networks from either a simple list of genes or from genes combined with omics data - without relying on prior gene–gene interaction data.
|
NetCrafter quantifies shared biological functions among genes using resources such as the Gene Ontology (GO), Human Phenotype Ontology (HPO), Hallmark genesets and Oncogenic Signature collections, allowing users to contextualize their results within well-established functional and disease-related frameworks. >> See details of NetCrafter ontologies and geneset signatures This ontology-based scoring enables the creation of networks that reflect functional similarity and highlight key gene clusters (hotspots) related to biological pathways or disease phenotypes. |
 NetCrafter is integrated into Q-omics platform
|
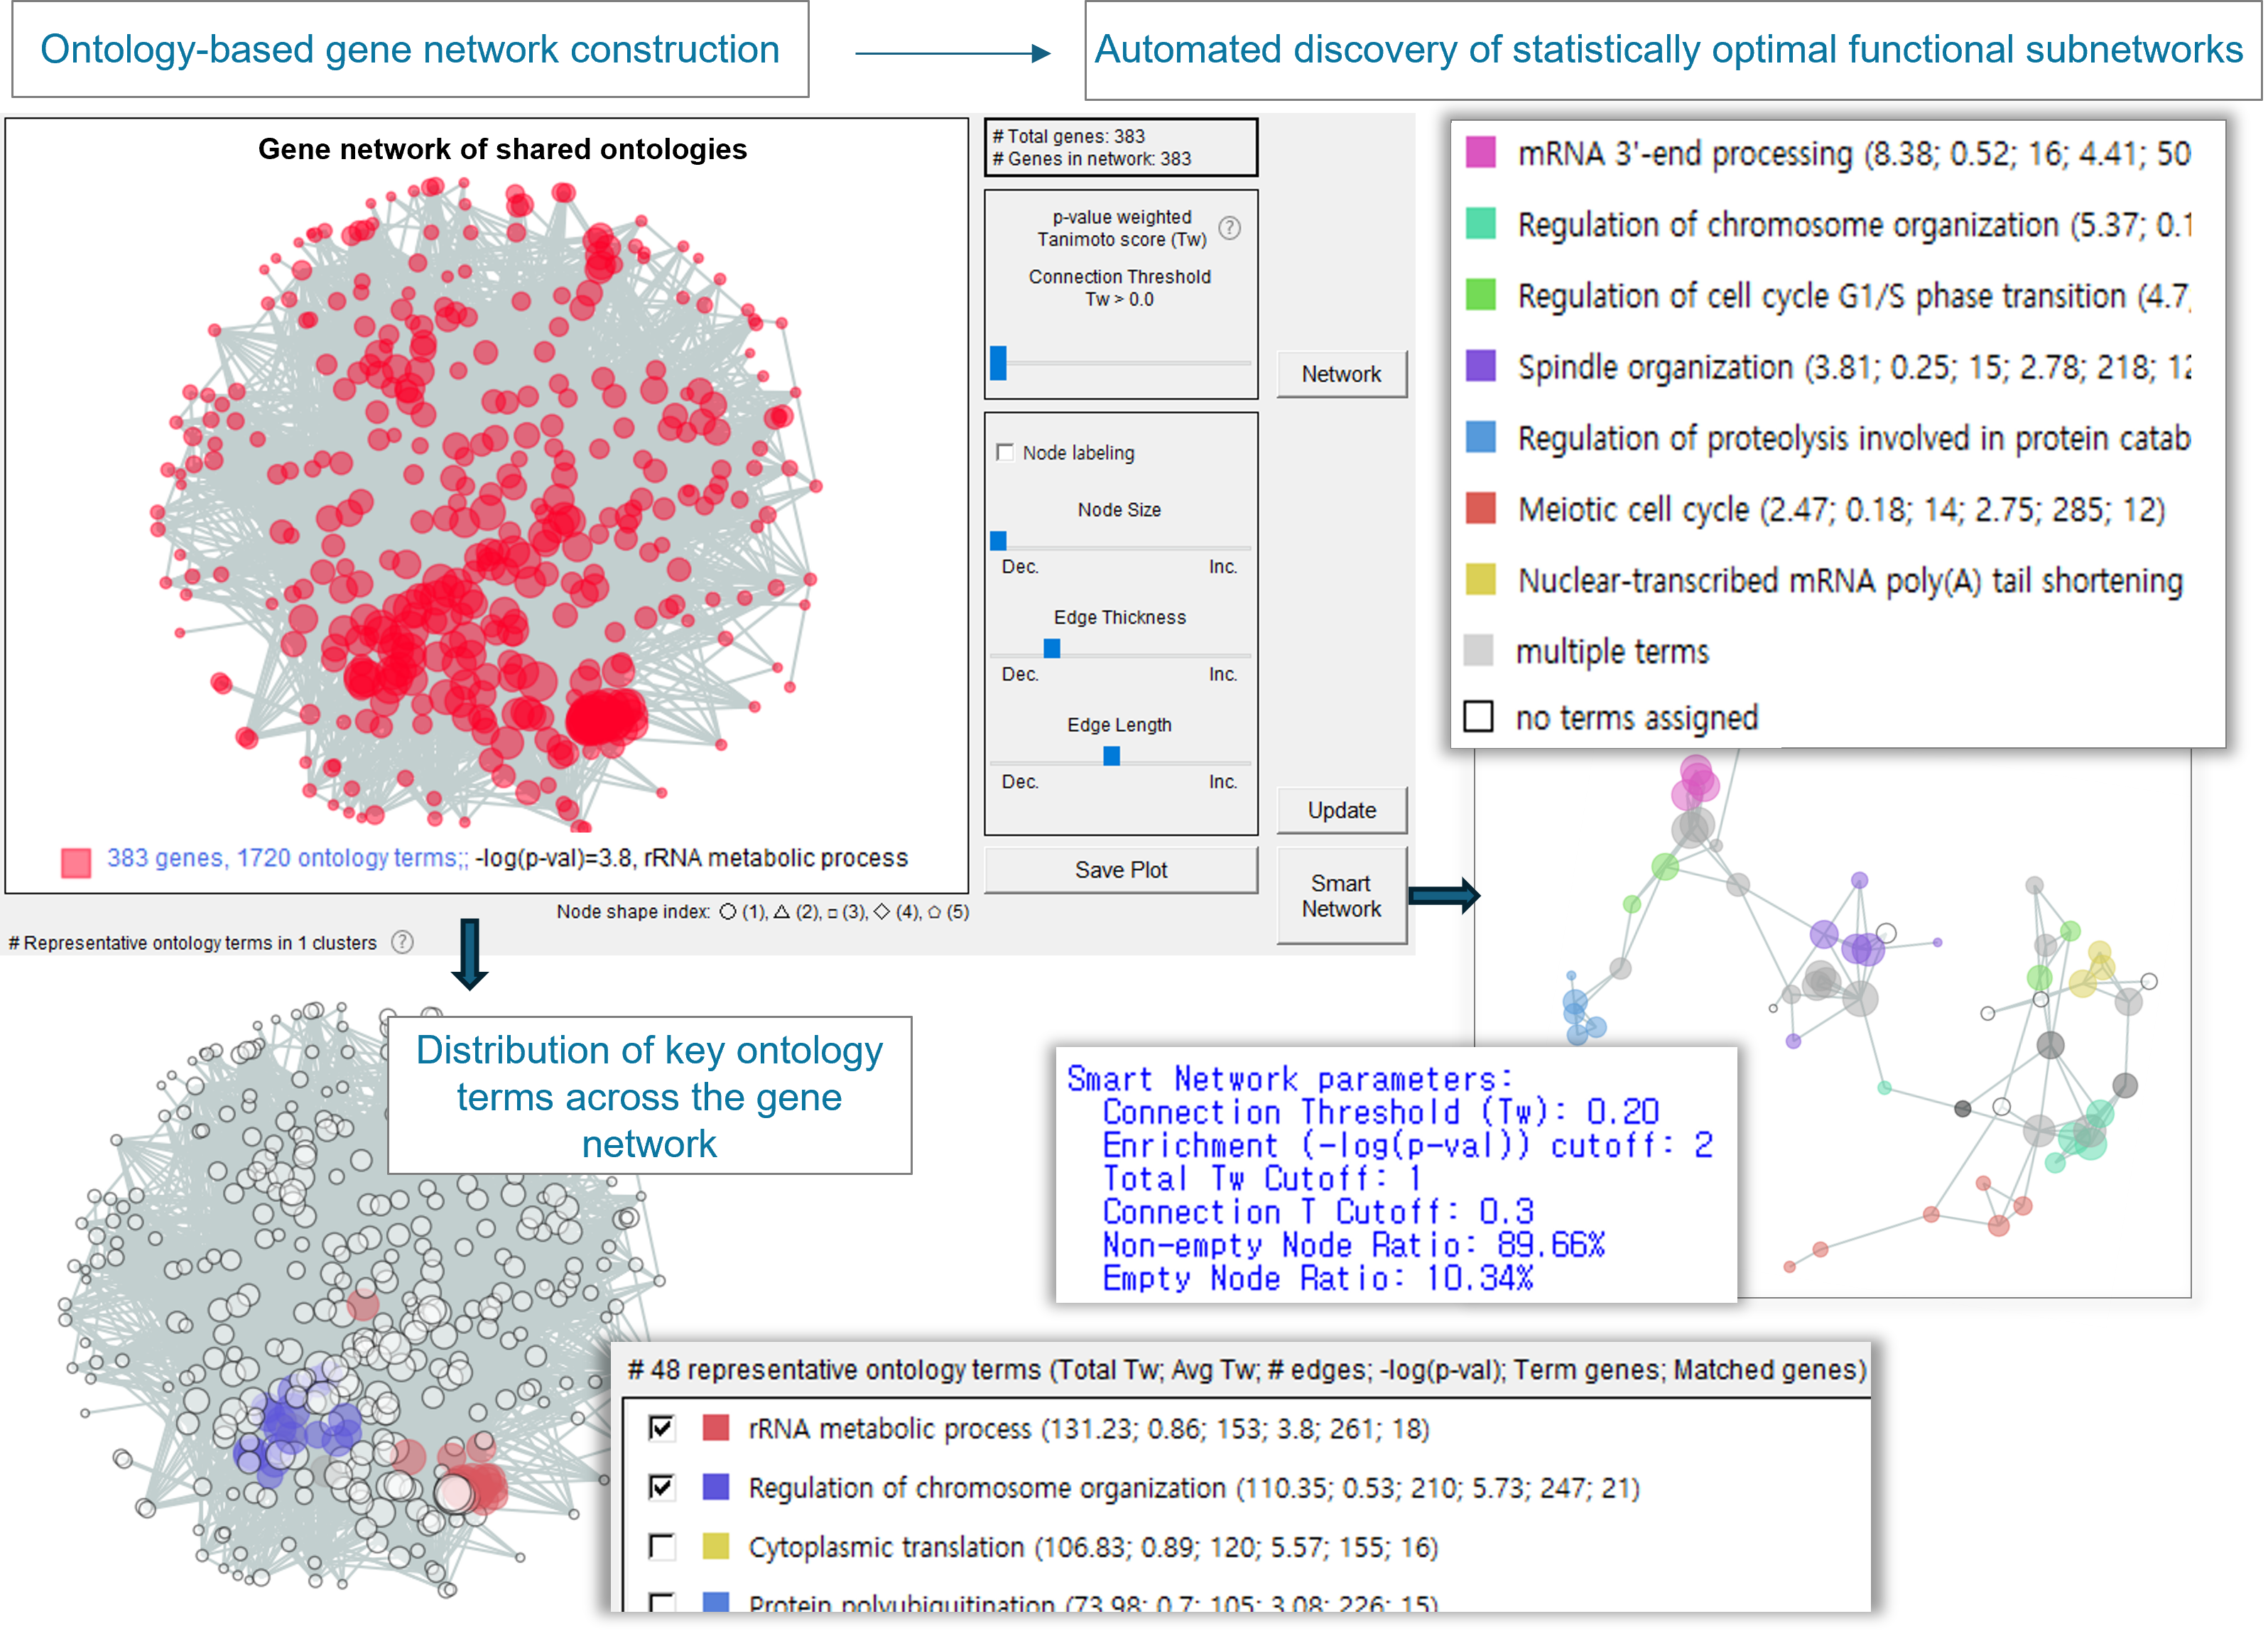
Figures illustrate the process of generating networks using Gene Ontology Biological Process (GOBP) terms, followed by the automatic interpretation of key functional interactions within the given gene list. |
 |
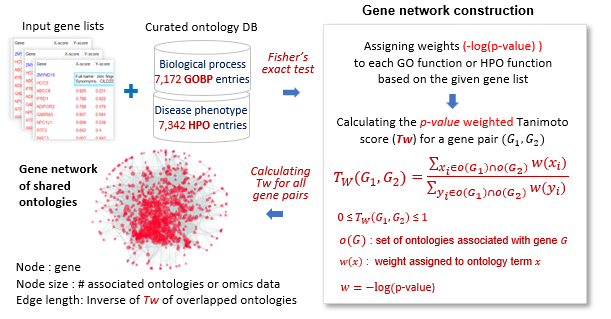
The figure illustrates the process of generating networks using Gene Ontology Biological Process (GOBP) terms and Human Phenotype Ontology (HPO) terms containing 3 to 300 genes.
For a gene list, the -log(p-value) of each ontology term was calculated using Fisher’s exact test. 𝑇𝑤(𝐺1,𝐺2) denotes the p-value weighted Tanimoto score.
 |
NetCrafter offers interactive ontology clustering and supports the integration of multiple datasets, making it a powerful tool for exploring gene functions, interpreting omics data, and identifying potential biomarkers or therapeutic targets.
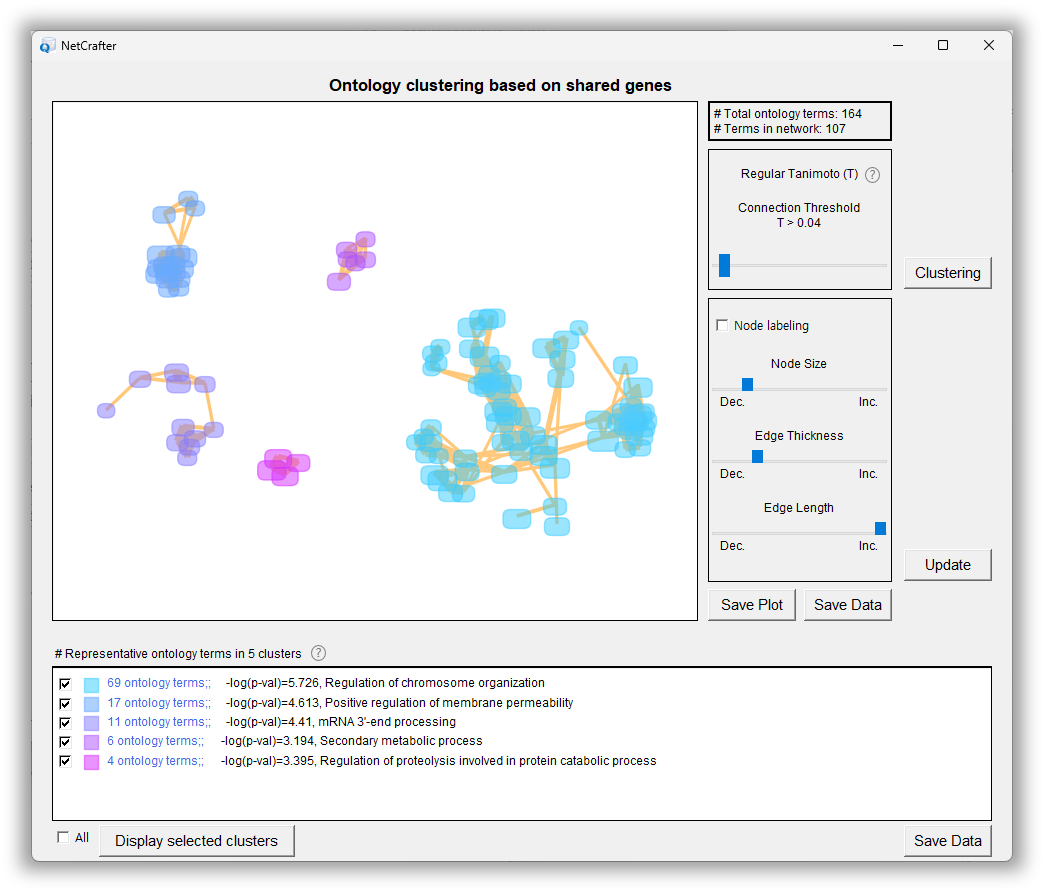 |
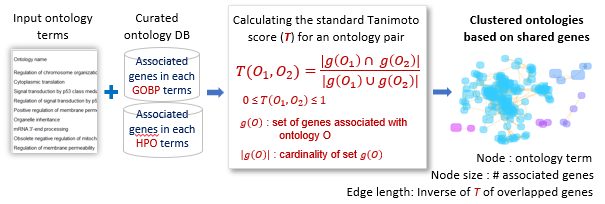
Input ontology terms were clustered using the regular Tanimoto index between terms, 𝑇(𝑂1, 2), which measures the overlap in shared genes.
 |
 Windows
 macOS
macOS