1. Main Functions of NetCrafter

This program automatically generates networks based on Tanimoto coefficients using Gene, GO, and HPO
inputs.
The results can be saved as PDF, JPG, or PNG files.
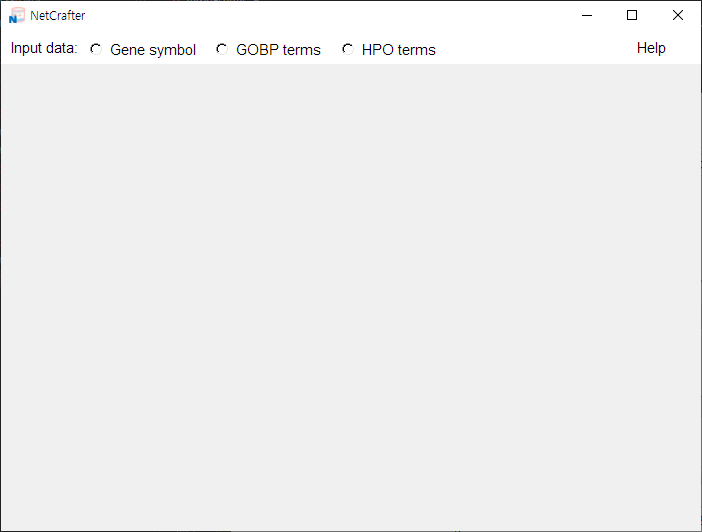
1.1 Running NetCrafter
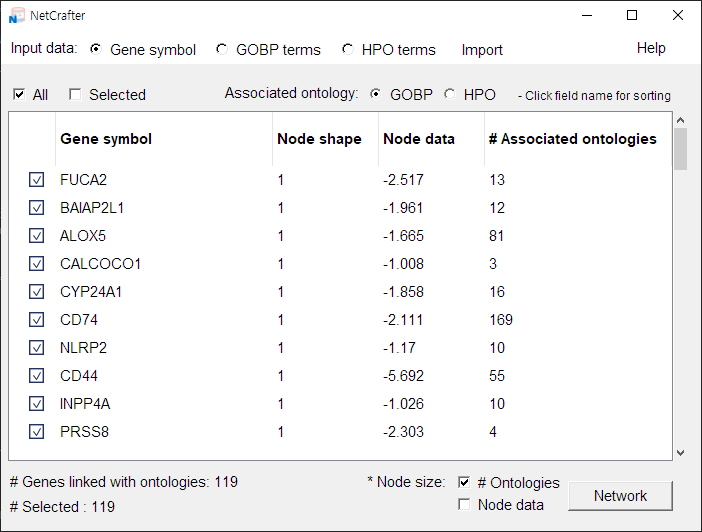
- When NetCrafter starts, the main window appears as shown below (screenshot
captured on Windows):
-
1.2 Loading Data
- Demo files are included when you download NetCrafter from the main page.
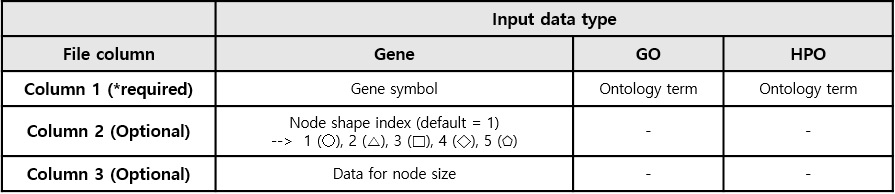
- 1) Select the input node data type: Gene, GOBP or HPO.
- 2) Click the [Import] button.
- 3) Select your input file (CSV or TXT format).
-
When the data file is opened successfully, the data matrix is displayed in the main panel:
-
1.3 Selecting Data
- You can deselect genes or functions that you don't want to display in the network. Here’s how:
-
1) You can sort the data by clicking the field names.
-
2) If there are only a few items you want to exclude, you can remove them
manually.
• Simply click the checkbox next to each gene or
function to remove it from
the network.
-
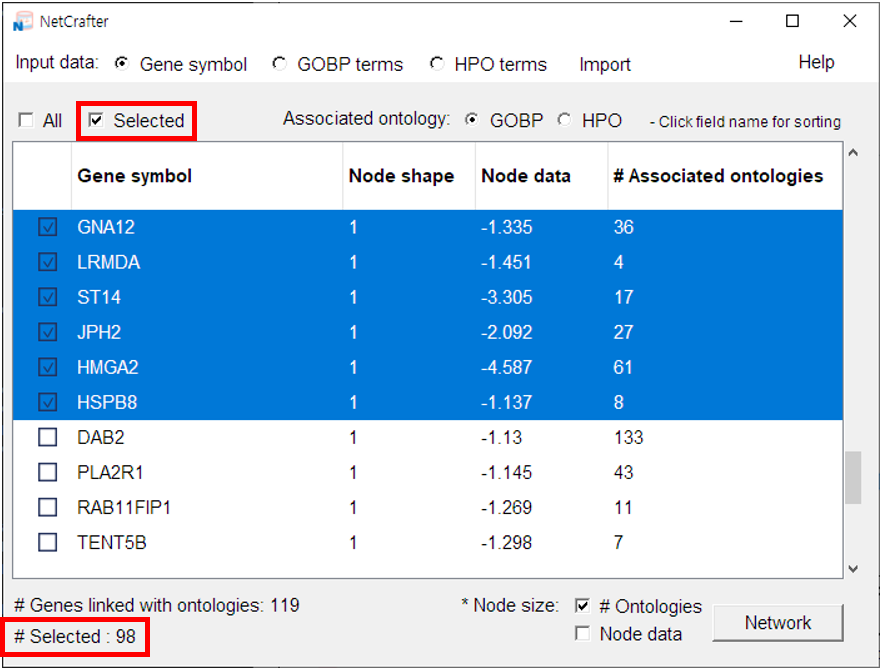
3) For a larger number of items, use a filter or batch selection for quicker
management:
• Hold down the Shift or Ctrl key
(Shift or Command on macOS) while clicking rows to select multiple at once — selected rows
will be highlighted in blue.
• Click the [Selected] button to toggle the
checkboxes in the leftmost column for those rows.
-
4) The total number of selected items is automatically updated and displayed at
the bottom of the window.
-
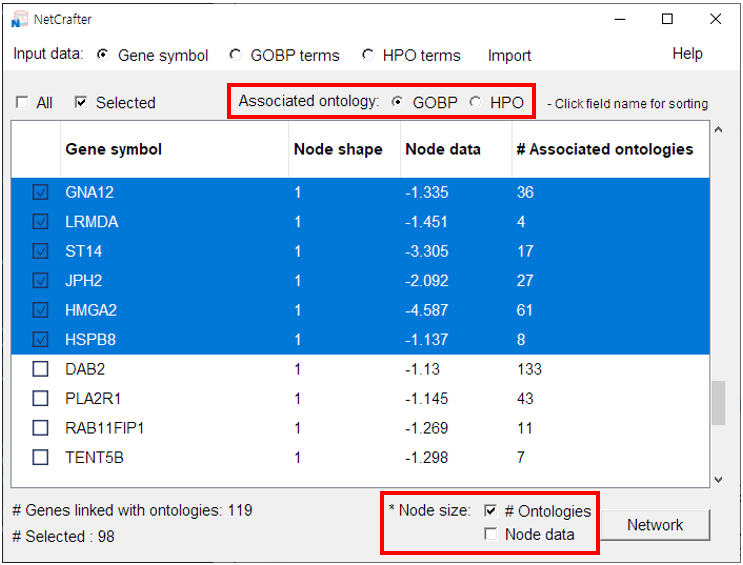
1.4 Initial Settings (Gene Network)
- You can customize two main settings for the Gene Network:
- 1) Tanimoto calculation sources: [ GOBP / HPO / Hallmark Gene Sets /
Oncogenic Signatures ]
-
2) Node size options: [ Sum of Tw / Sum of -logP / Node data ]
• Sum of Tw: Scales nodes by the total Tw value of
each associated gene.
• Sum of -logP: Scales nodes by the combined -logP
values of each associated gene.
• Node data: Scales nodes using values provided
directly in your input file.
-
3) Consensus calculation:
• When the data includes two or more node shapes (i.e.,
from multiple experiments or gene sets), p-values are automatically combined across gene sets using the
chi-square method.
-
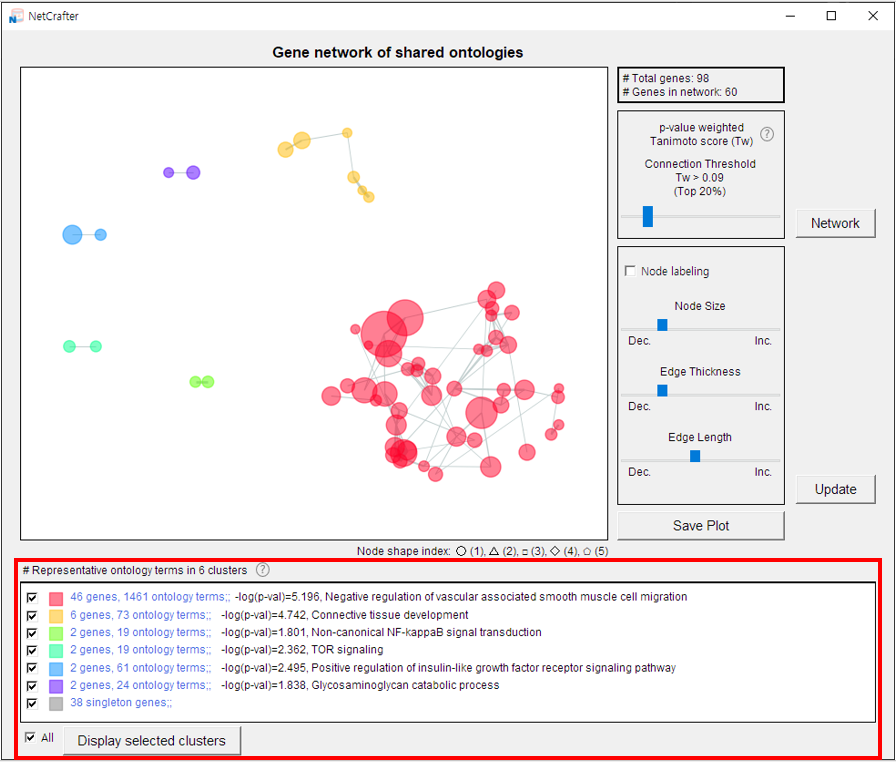
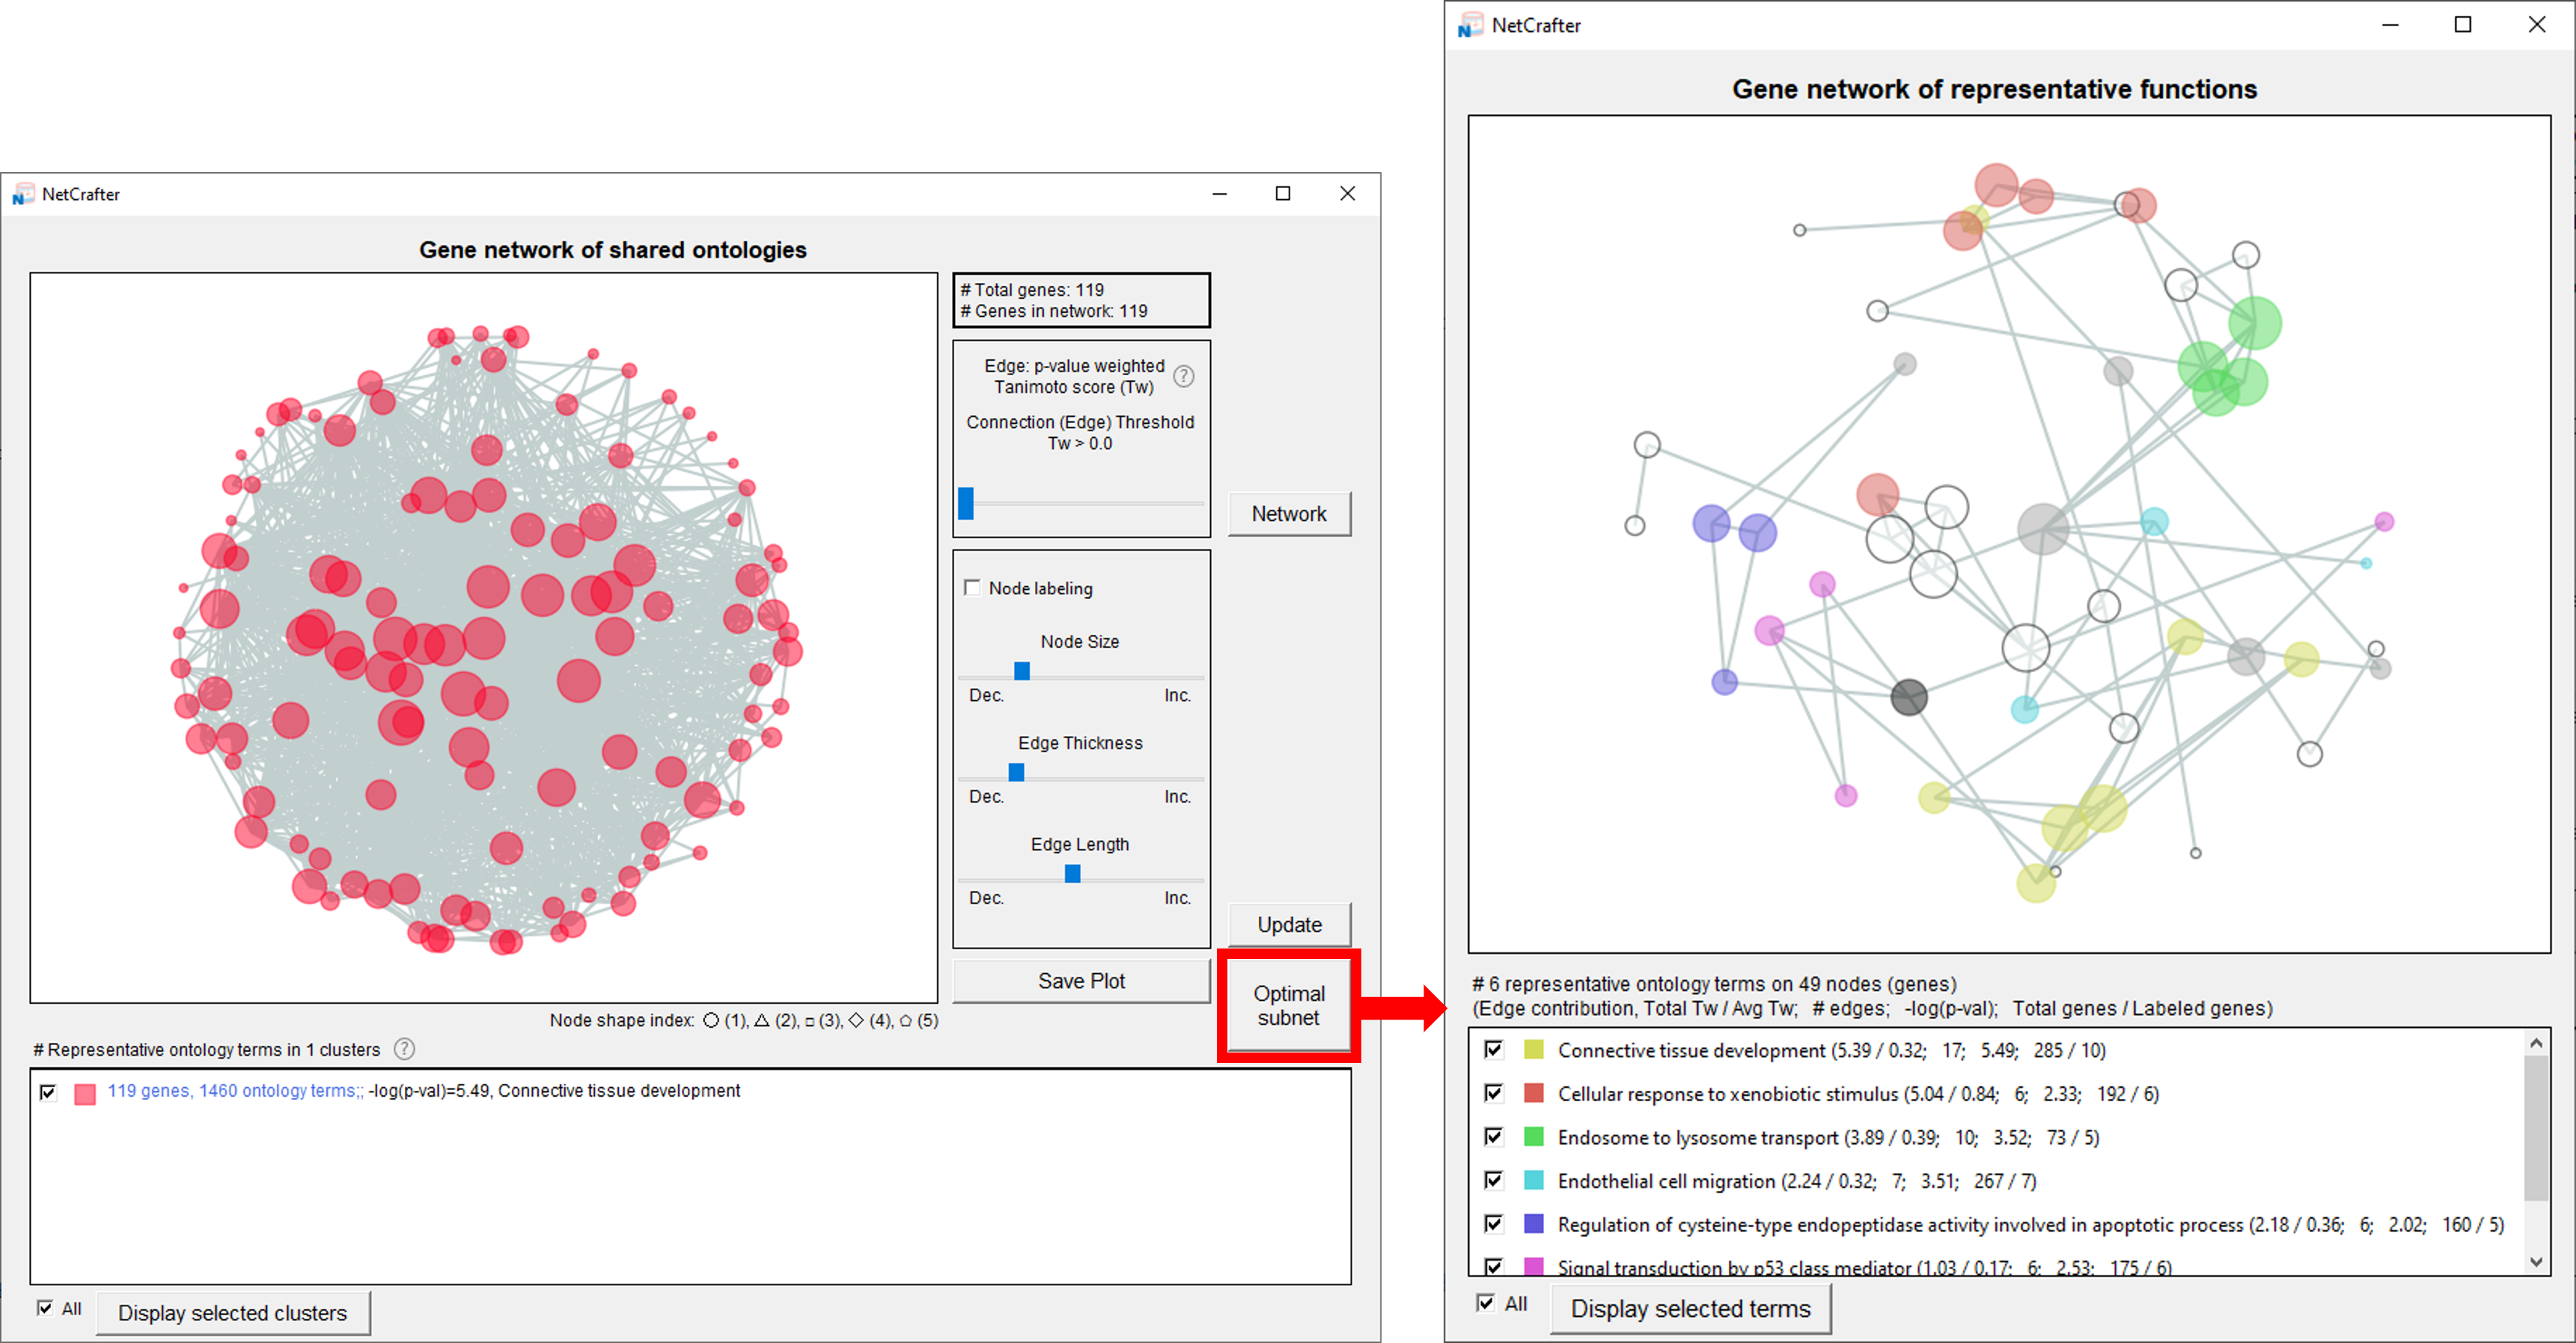
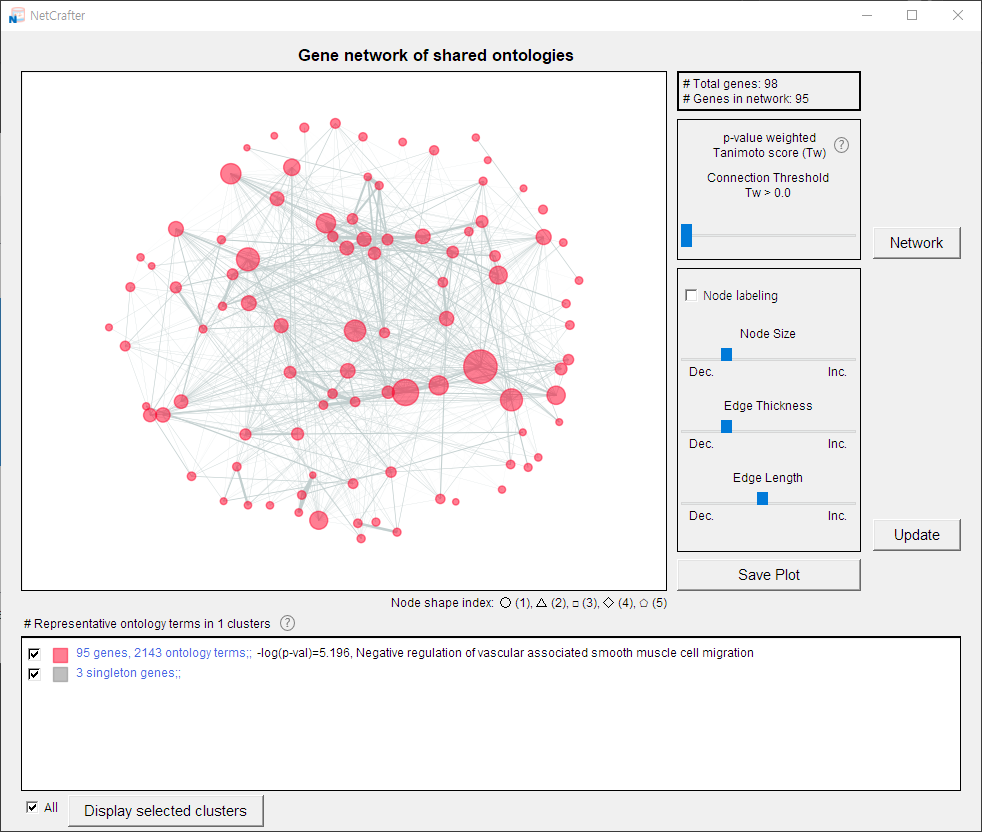
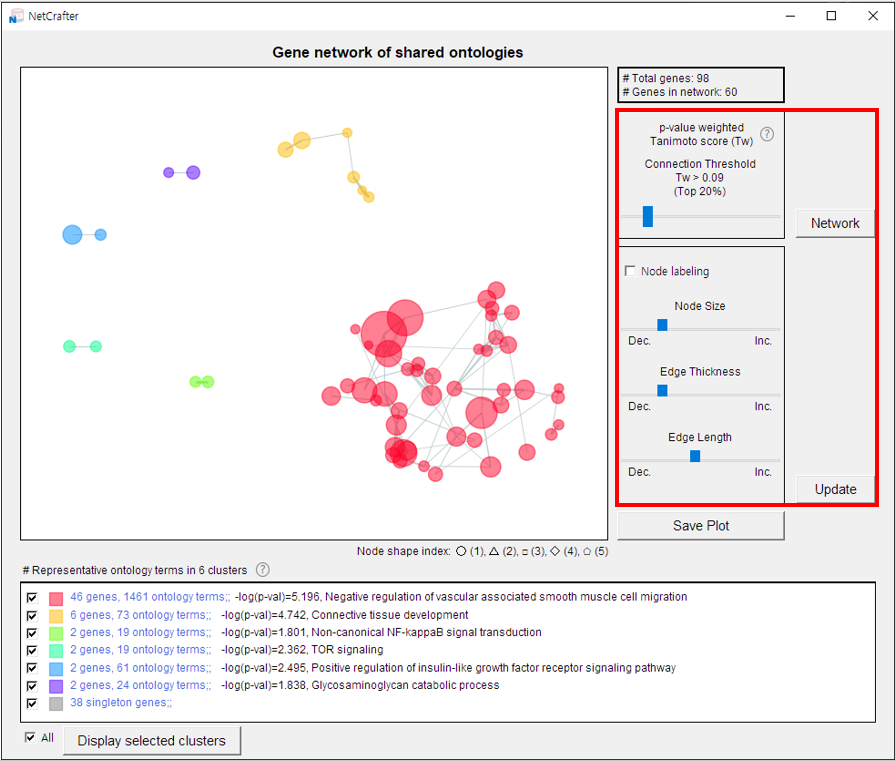
1.5 Visualizing the Network
- Once your data is loaded, you can generate and explore the network:
- 1) Click the [Network] button to open a new window displaying the
network.
- 2) Hover over a node to view its name.
- 3) The total number of nodes is shown in the upper-right corner.
-
4) Use the control panel (below the node count) to adjust the network display.
Details on these controls are provided in Chapters 2
and 3.
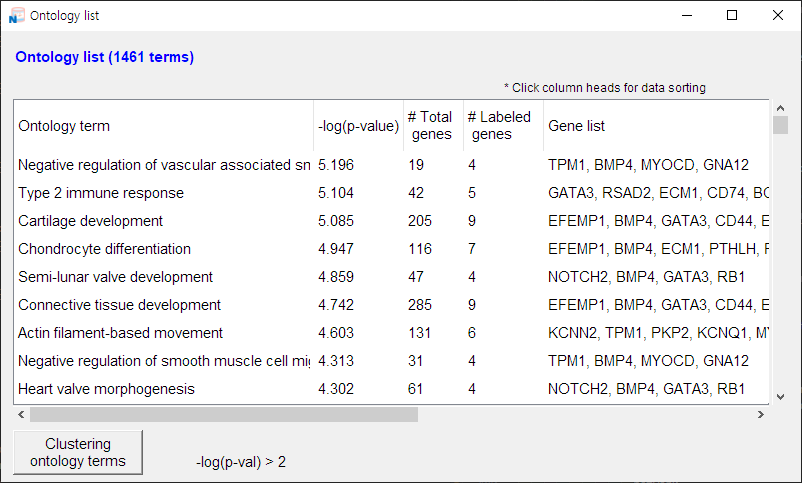
- 5) At the bottom of the window, the functions representing each group are
displayed.
-
1.6 Saving Data
- 1) Click the [Save Plot] button at the bottom of the control panel on
the right.
- You can save your plot in the following formats:
-
| Format |
Description |
| PDF |
Portable Document Format — best for sharing and printing |
| JPG |
Image file with high-quality resolution |
| PNG |
Image file with lossless compression |
- 2) Enter a name for the file and click the Save button.
2. Customizing the Network
This application provides four options for customizing the visualization.
You can optimize the network by adjusting these options in the panel on the right—no graphic design skills
required.
In this chapter, each option will be explained step by step, following the layout from top to bottom.
2.1 Control Panel
- 1) Network connection threshold
-
Adjust the Tanimoto cutoff using the scaling slider. Only nodes connected by edges with a Tanimoto score
above the cutoff will be displayed in the network.
After setting the cutoff value, click the [NETWORK] button to regenerate the network. The nodes
and edges will be redistributed based on the new input.
- 2) Node options
-
• Node labeling — Display node labels by selecting the checkbox.
• Node size — Adjust the scale to increase or decrease the size of
nodes.
-
Once the settings are adjusted, click the [UPDATE] button to apply your changes.
- 3) Edge options
-
• Edge thickness — Adjust the scale to make edges thicker or thinner.
• Edge length — Increase the scale to spread clusters further apart
in the network.
-
After modifying the settings, click the [UPDATE] button to confirm the changes.
-
2.2 Cluster Selection
-
The NetCrafter software automatically calculates similarity using Tanimoto coefficients to generate
clusters.
-
The final option for customizing the network is cluster selection.
Representative functions of the groups—identified by their connected nodes—are displayed in the bottom
section of the interface.
- 1) Deselect the clusters you do not want to display in the network.
- 2) Click the [Display Selected Cluster] button to apply your changes.
-
The network will update to reflect your selection.
-